Signals spread across teams
Finance and leadership teams needed a clearer way to interpret revenue, churn, pipeline, and support health together.
Case study
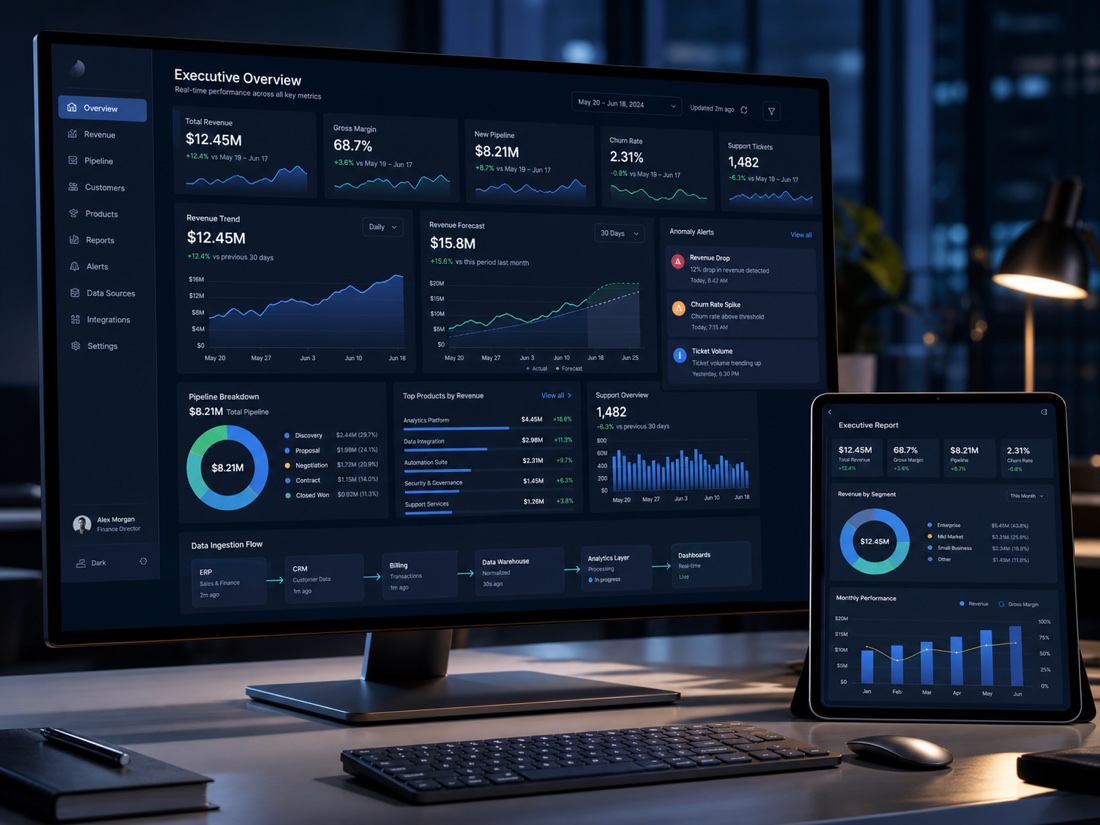
A finance and leadership dashboard concept that brings revenue, churn, pipeline, support signals, secure data ingestion, and AI-assisted reporting into one board.
Overview
FinSight was shaped for finance and leadership teams that need a single view across revenue, churn, sales pipeline, and support signals. The dashboard concept turns scattered metrics into a clearer decision workflow.
AI-assisted reports and anomaly alerts help leaders spot changes sooner, explain what is happening, and decide what to inspect next.
Finance and leadership teams needed a clearer way to interpret revenue, churn, pipeline, and support health together.
The concept combines data ingestion, metric modeling, AI report drafting, anomaly alerts, and executive dashboard views.
Leaders can review priority signals, understand trend movement, and move from dashboard review to action planning faster.
Scope
Revenue, CRM, support, and product signals are modeled into a clean dashboard-ready data layer.
Churn, pipeline, margin, support pressure, and forecast metrics are shaped around how leaders review performance.
Dashboards prioritize concise comparisons, trend movement, drilldowns, and board-ready summaries.
Teams can define thresholds, anomaly triggers, and ownership for follow-up when metrics shift.
AI workflow
The AI layer helps leaders understand what changed, why it may matter, and which data points deserve attention. It supports decision review instead of replacing the dashboard with vague generated text.
Implementation direction
The product direction covers data pipelines, metric definitions, permissions, dashboard UX, anomaly logic, and AI summaries that cite the source metric context before users act on a recommendation.
We can build secure dashboards, reporting pipelines, and practical AI insights around your business data.